

Remove higher grating orders effectively in your spectrometer
Optimum order sorting filters for spectrometers
Diode Detector Array (DDA) spectrometers are widely used because they enable compact, robust, and relatively inexpensive instruments for spectral analysis. Due to these benefits, DDAs are commonly used in educational, industrial, and out-door environments where portability, ruggedness and stability are of essence.
The spectrally selective component inside a DDA is a diffraction grating which disperses the spectrum across an array of photo-detectors. A fundamental property of diffraction gratings is that they disperse multiple “copies” (called orders) of the wavelength into multiple different angles.
The multiple orders become problematic when the detected spectrum covers more than one octave. In this situation the orders overlap and it is therefore difficult to interpret the detected spectrum.
The solution is to insert so-called order sorting filters in the spectrometer immediately before the detector. One or a few simple blocking filters can remove higher orders but, introduces undefined spectral regions around the filter transitions.
This technical note describes how Continuously Variable Order Sorting Filters (CVOSF) removes higher orders effectively with minimal introduction of undefined spectral regions.
How a diode array spectrometer works
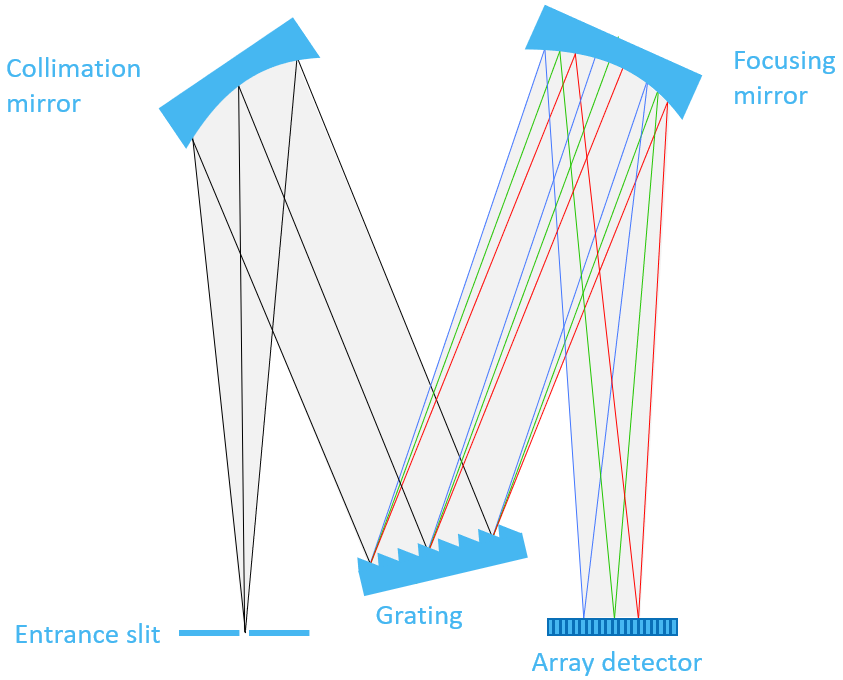
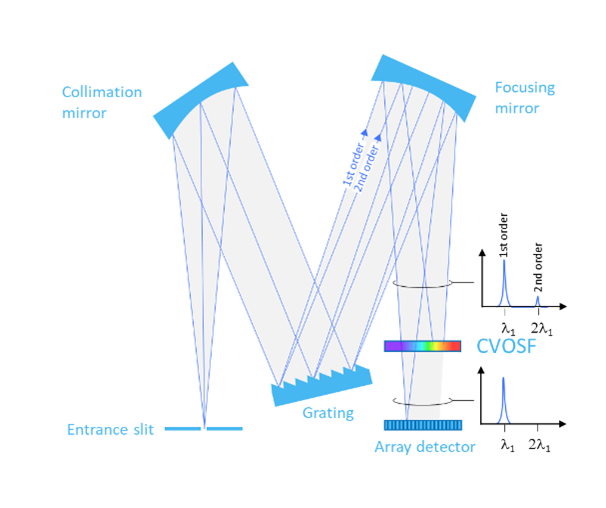
Figure 1 shows a typical design of a spectrometer. Broadband light enters the entrance slit within a certain numerical aperture and is collimated by a mirror. The diffraction grating diffracts the various wavelengths into distinct angles which are then focused onto the array of photodetectors. In this way, a specific location on the detector array corresponds to a specific wavelength. Normally, the spectrometer is designed to utilize the 1st order diffraction of the grating as explained in the next section.

Higher orders in diffraction grating
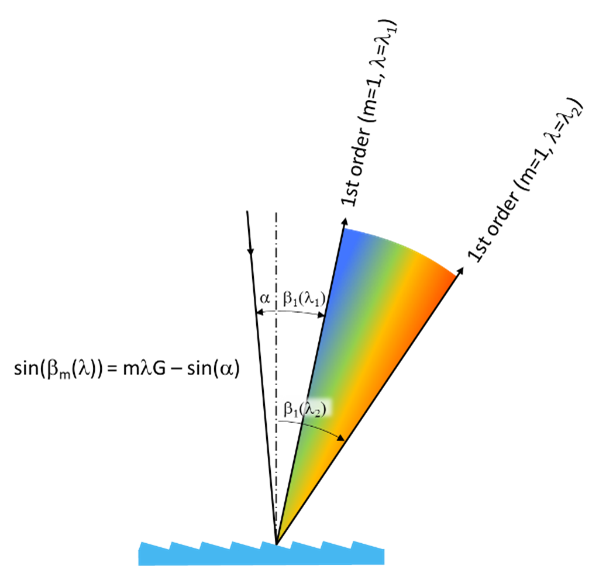
A diffraction grating is a periodic structure where the period is in the same order of magnitude as the wavelength. When light at a wavelength λ is incident on the grating surface at an angle α, the grating will diffract light only in distinct directions βm (called orders) as illustrated on Figure 2.

The diffraction is governed by the grating equation:
sin(α)+sin(β_m (λ))=mλG
Where α is the angle of incidence, βm is the diffraction angle, m is the order, λ is the wavelength and G is the groove density.
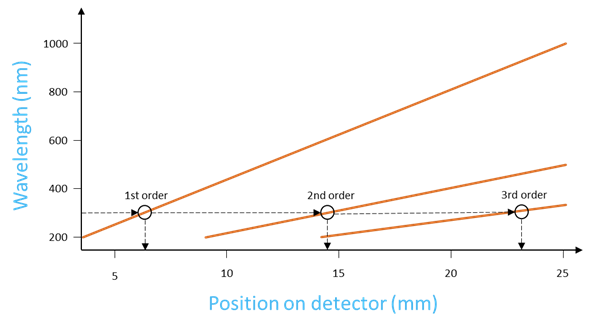
The diffraction angle is wavelength dependent as seen from Eq. 1, which means that a spectrum of broadband light can be angularly separated as shown on Figure 3.
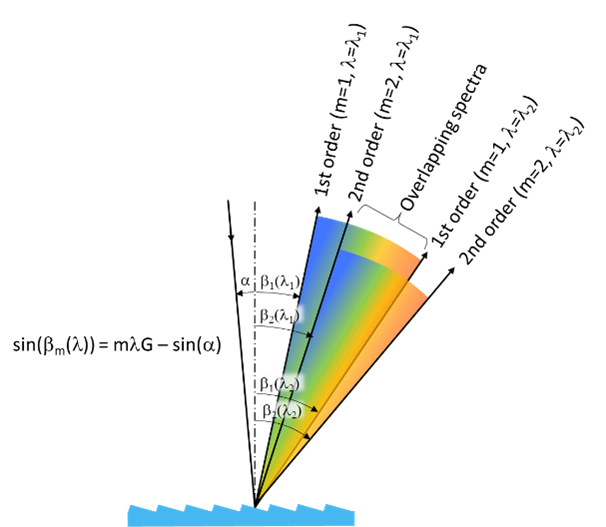
When the measured light covers more than 1 octave (β2 > 2β1) the spectra of the diffraction orders overlap as illustrated on Figure 4 for the 1st and 2nd order.
How higher orders affect the spectrum in a DDA
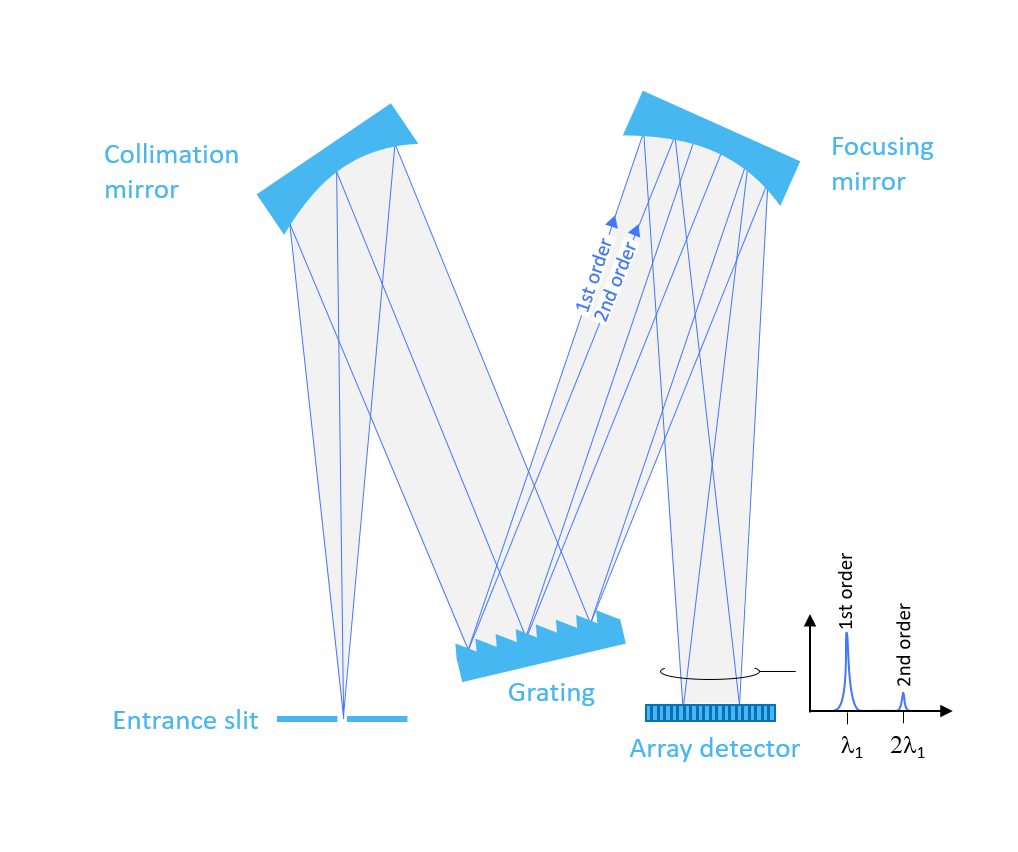
The overlapping spectra of the diffraction orders pose a severe problem in a spectrometer. Figure 5 illustrates this with a simple example.
The input is mono-chromatic light with a wavelength of λ1 and therefore, you should expect the spectrometer to display only a single peak at this wavelength.
However, due to 2nd order diffraction there is a second peak that appears to be at a wavelength of 2λ1. In a real measurement it is generally impossible to tell whether the second peak is a genuine peak originating from light at 2λ1 or it is just second order light from λ1.
For this reason it is desirable to remove all higher order before they reach the detector.
The order location diagram shown on Figure 6 is useful to get an overview of the location of the orders on the detector is as a function of wavelength. The vertical axis is the wavelength and the horizontal axis is the corresponding location on the detector. For instance, at 300 nm the first order will be located at 6.3 mm, 2nd order at 14.5 mm, and 3rd order at 23.3 mm.
Order Sorting Filters
A common method to remove higher order spectra in DDAs is to insert an Order Sorting Filter (OSF) in front of the detector array as illustrated on Figure 7.
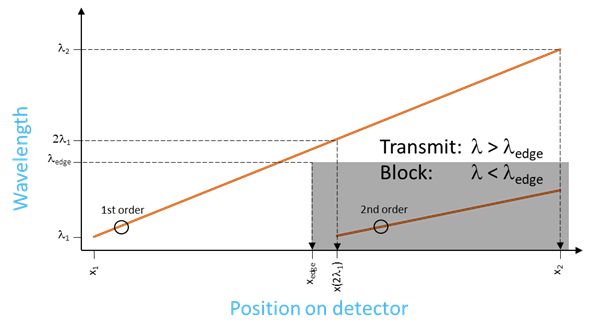
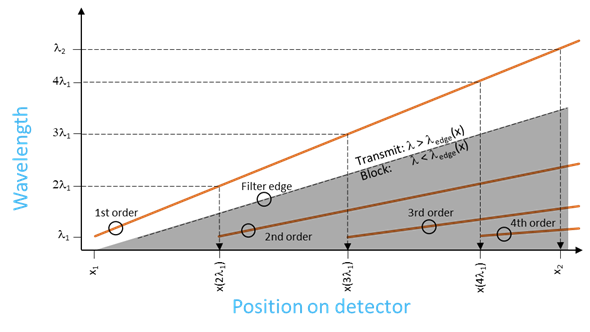
The simplest type of order sorting filter is a homogenous blocking filter that covers the upper part of the detector. In general, it is possible to use a single homogeneous OSF when only 1st and 2nd orders are present; i.e., when 2λ1 < λ2 < 3λ1. The order sorting filter which is a Long Wave Pass filter with a filter edge at λedge, can conveniently be plotted in the order location diagram as shown on Figure 8. The order sorting filter physical edge xedge should be positioned just below the onset of the second order x(2λ1) and block the 2nd order wavelengths while transmitting the 1st order.
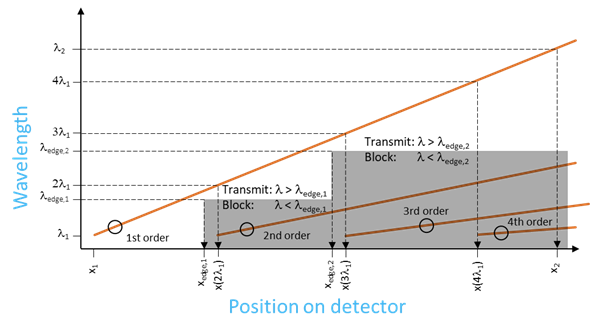
In case the wavelength range λ1 to λ2 is wider such that 3λ1 < λ2 < 6λ1, two homogenous order sorting filters are needed as illustrated on Figure 9.
From the order location diagrams it is obvious that the ideal order sorting filter would be a Long Wave Pass filter where the wavelength edge increases continuously with the position on the detector. This is possible using a suitable Continuously Variable Long Wave Pass Filter (CVLWP) as shown on Figure 10.
Download this White Paper
Take advantage of this opportunity to expand your knowledge and accelerate your research.
Download this current white paper
Edge effects of filters
As described in the previous section, order sorting filters will typically introduce one or more physical transitions between filter regions.
Light that hits these transitions will be distorted by a combination of diffraction, refractions, and specular and diffuse reflections leading to a distortion of the spectrum just beneath the filter physical edge as schematically shown on Figure 11.
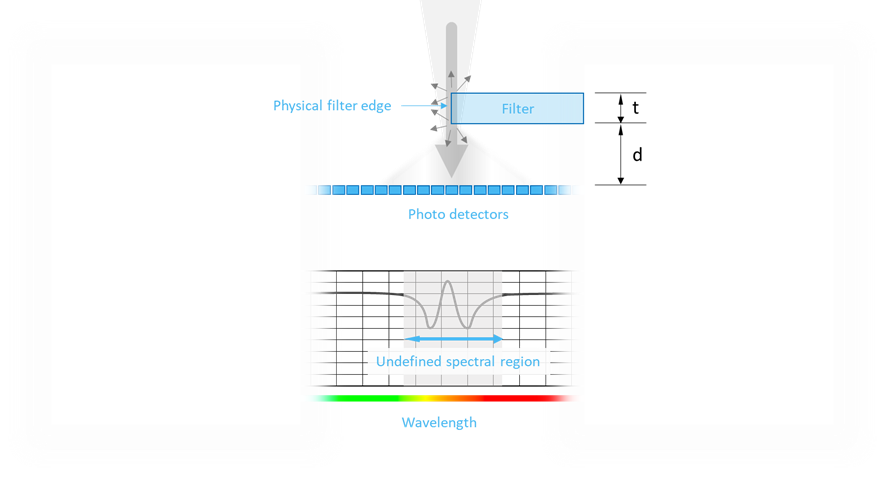
In the theoretical limit where the filter edge is sharp and well-defined like a knife edge the pattern would be a quite broad “ringing” modulation of the spectrum but, in a practical case the pattern will be more unpredictable.
The larger the distance d between the filter and the array of photodetectors, the wider the disturbance. The thickness and surface structure of the filter edge as well as the angular span of the incident light also effect the spectral disturbance.
Implementations of order sorting filters
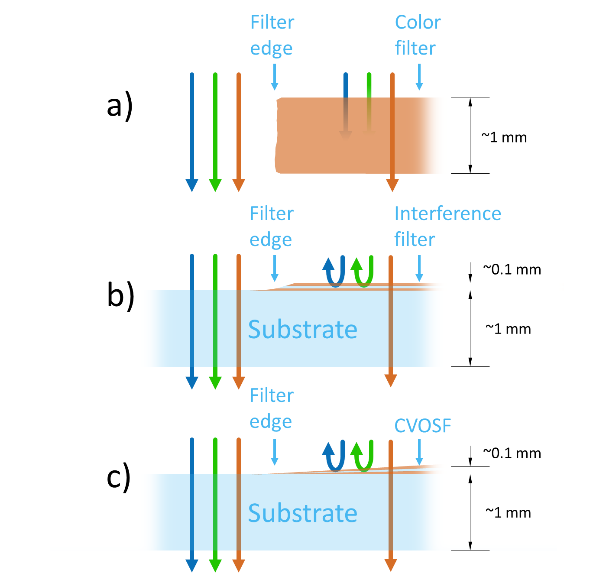
Order sorting filters can be implemented as either color filters or interference filters as illustrated on Figure 12.
Color filters
Color filters typically consist of a dye incorporated in a substrate material. These filters function by absorbing parts of the spectrum and transmitting others. For instance, a red glass will allow wavelengths above approximately 600 nm to pass while absorbing wavelengths below 600 nm. The absorption and transmission depend on the thickness of the filter.
The key benefit of a color filter is that it absorbs the unwanted light which means that there is less stray light to consider in the spectrometer. However, color filters have several drawbacks. First, the usable edge wavelengths are limited by the dyes available. Furthermore, the physical cut or diced edge of the mm-thick filter glass typically leads to a relatively wide undefined spectral region as explained in the previous section.
Homogeneous interference filters
Interference filters consist of many thin layers of dielectric materials of different refractive index and thickness on a glass substrate. As the name implies, an interference filter functions by transmitting wavelengths with constructive interference in the dielectric stack while reflecting the remaining wavelengths.
The key benefit of interference filters is that they can be designed and manufactured exactly as required by a given application. Another benefit is that the physical edge of the filter can be more precisely controlled leading to fewer problems with undefined spectral regions.
It is worth noting that the blocked light in an interference filter is reflected. This can be considered a drawback compared to color filters because the reflected light can lead to additional stray light in the spectrometer.
Continuously Variable Filters
Continuously Variable Long Wave Pass filters (CVLWPs) are implemented as interference filters where the wavelength edge varies along the length of the substrate. The filters are implemented by continually increasing the thickness of the filter from one end of the substrate to the other.
The CVLWP may extend over the full wavelength range (as illustrated on Figure 10) and therefore the filter does not have any edge effects at all. In other situations, typically for spectrometers covering part of the UV-spectrum, the CVLWP filter does have a small physical edge as indicated on Figure 12 c). However, since the filter thickness is quite thin at the edge, the spectral distortion is generally smaller than what is seen with homogeneous filters.
Learn more
Delta Optical Thin Film is the world leader in Continuously Variable Filters for the 300 – 1200 nm wavelength region and we have produced thousands of CVLWP filters for some of the leading suppliers of diode array spectrometers.
You can find more details about our Continuously Variable Order Sorting Filters on our web-page here.
Meet the author
Stay updated on our expert insights
Get the latest news and insights about optical filters – subscribe to our newsletter.