

Learn how to use optical filters for fluorescence spectroscopy
Fluorescence spectroscopy
Photo-luminescence is the phenomenon that a material emits light after having absorbed light. When the emission of light happens almost instantaneously (in nanoseconds) it is called fluorescence and when the emission decays over longer time (milliseconds) it is called phosphorescence. A material that exhibits fluorescence is called a fluorophore and such materials are used extensively in the analysis of biological materials.
Fluorophores as markers
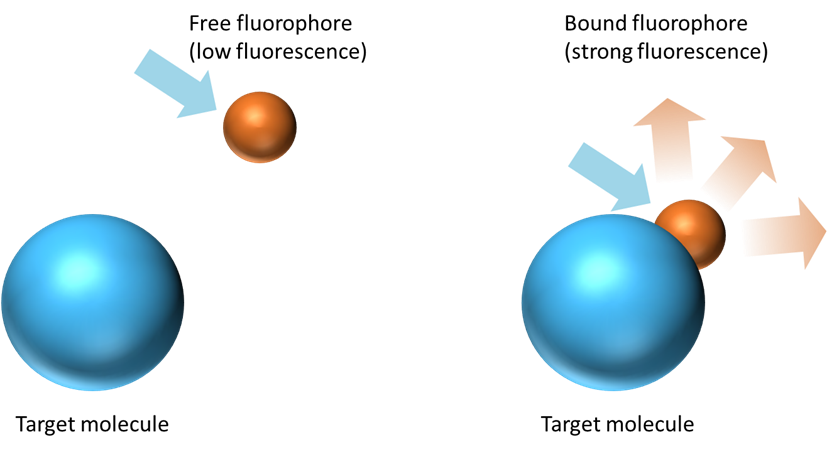
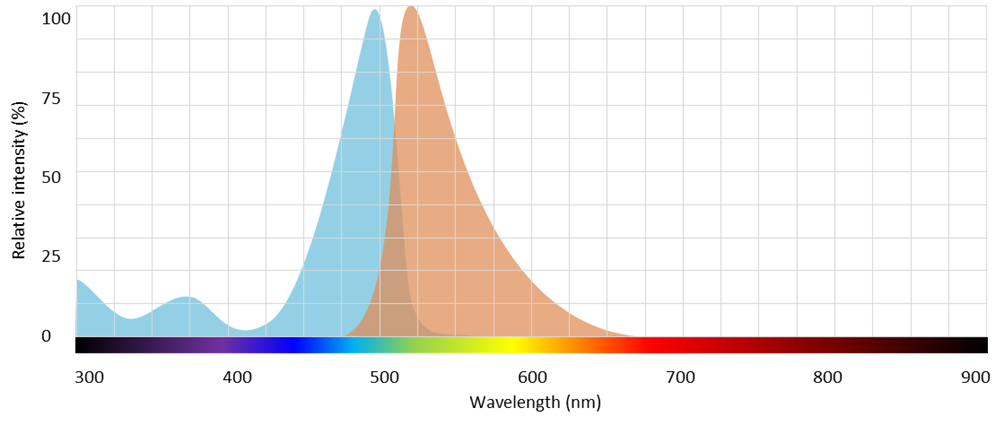
Fluorophores are commonly used as markers of specific molecular structures or reactions. When the fluorophore binds to its specific target molecule (like a nucleic acid) the fluorescence efficiency is enhanced as illustrated on Figure 1.

Why optical filters are needed
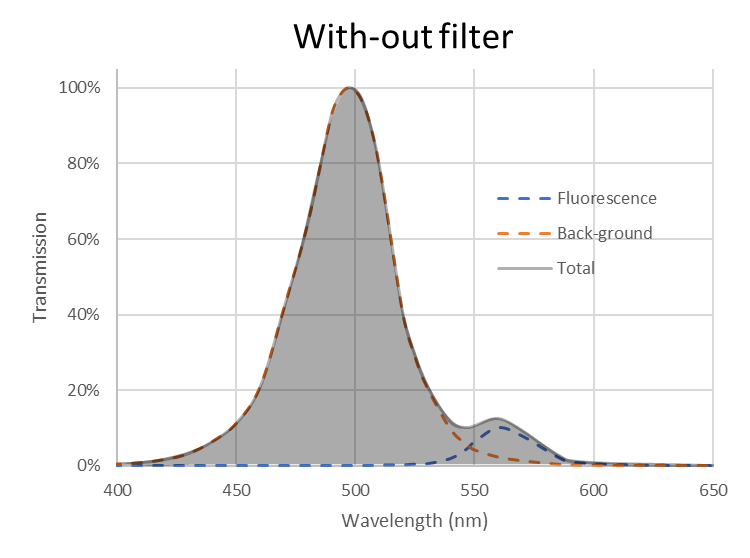
The fluorescence signal is often weak and can be buried in a much stronger back-ground signal as shown on Figure 2. A photodetector, like a photo-multiplier or a silicon photodiode, detects the total intensity (the gray area under the curve) and therefore, it can be difficult to differentiate between small changes in the fluorescence signal. Also, we are only interested in changes in intensity at the fluorescence emission peak (around 560 nm on Figure 2).
For these reasons, optical filters are typically used to block as much of the back-ground light as possible An example with an emission bandpass filter is illustrated on Figure 3. In the example on Figure 2 and Figure 3 the ratio between the fluorescence intensity to the totally measured intensity went from around 8% with-out filter to around 77 % with filter. This means that with the filter the reading from the photo-detector is much closer to the actual fluorescence signal than with-out the filter.

Basics of fluorescence
In fluorescence spectroscopy the light (photons) interacts with the electrons in the molecules of the fluorophore.
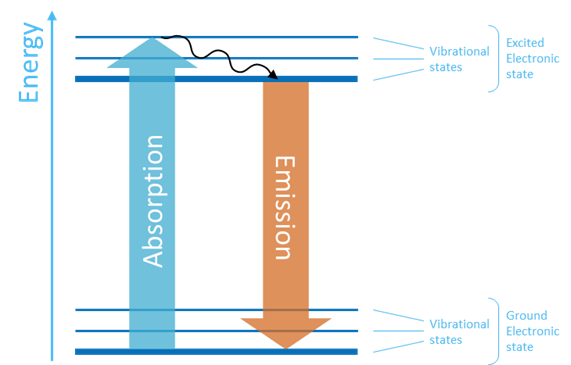
To understand what happens, we can look at the Jablonski diagram on Figure 4 which represents the electronic states of a molecule.
The molecule has a ground state with the lowest energy and an excited state with higher energy.
Within each of the electronic states the molecule can be in various vibrational modes with slightly different energy as indicated by the thin levels.
Light can be described as photons which each carry an energy equal to hc/λ where h is Planck’s constant, c is the speed of light and λ is the wavelength of light. Hence, the photon energy is inversely proportional to the wavelength of light.
When a photon with energy larger than the difference between the ground and excited states hits the molecule, the photon can be absorbed and the molecule is excited to a higher energy level. Some small amount of energy is lost due to collisions between the molecules, and the molecule quickly ends up in the lowest excited state level. From this state the molecule relaxes back to the ground state and emits a photon with energy equal to the energy difference between the two states.
From this description two important aspects of fluorescence spectroscopy can be learned:
- The wavelength of the emitted light is always longer than the wavelength of the absorbed light (because the photon energy is inversely proportional to the wavelength and because the emitted energy is less than the absorbed energy)
- Fluorescence is an almost instantaneous phenomenon (because the relaxation due to molecular collisions happens very fast)
Instrumentation
Fluorescence spectroscopy instruments generally fall into two categories: spectrofluorometers and filter fluorometers. The former scan the complete spectrum and are mostly general-purpose instruments whereas, filter fluorometers measure emission at one or a few discrete wavelengths and are mostly used for dedicated applications.
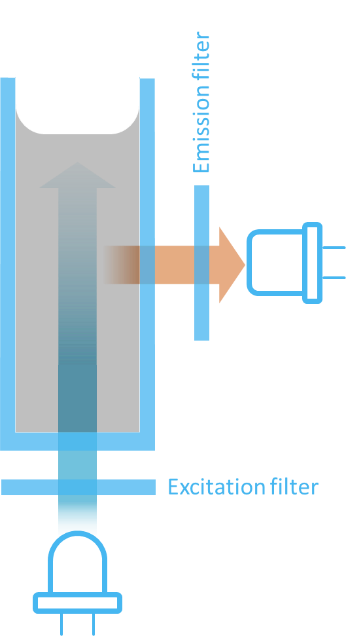
Figure 5 shows the basic components of a simple fluorometer. Broadband light from a light source is sent through an excitation filter that selects the right excitation wavelength for the fluorophore. In turn, the fluorophore will emit light in all directions. The light exciting at an angle of 90 degrees relative to the excitation light is sent through an emission filter that selects the emission wavelength of interest. Finally, the emitted light is detected by a photo-detector.
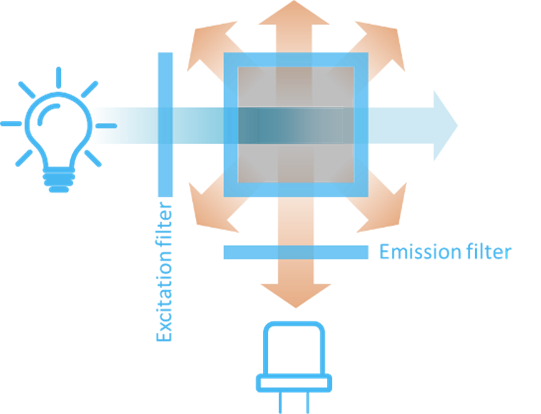
The 90 degrees angle arrangement on Figure 5 is advantageous because it hinders the strong light from the light source to hit the detector directly. In this manner, the weak fluorescence signal can be better detected.
For a spectrofluorometer either both or one of the filters on Figure 5 are replaced by scanning mono-chromators that can be adjusted to select any wavelength.
The excitation filter is also referred to as the primary filter and the emission filter is referred to as the secondary filter or barrier filter.
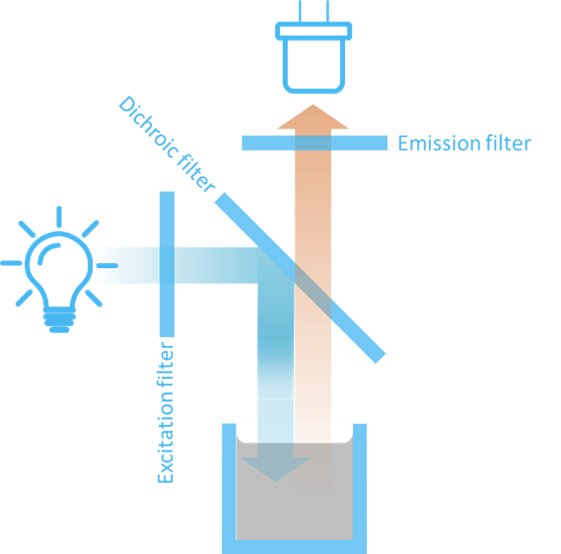
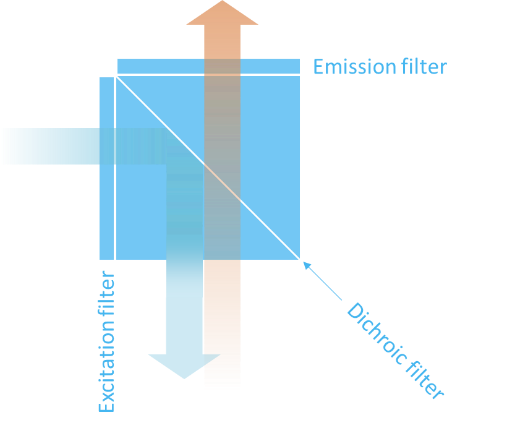
In certain applications – like microplate readers – the emission light has to be measured at an angle of 180 degrees rather than 90 degrees relative to the excitation light. For such applications, a set-up as shown on Figure 6 is generally used.
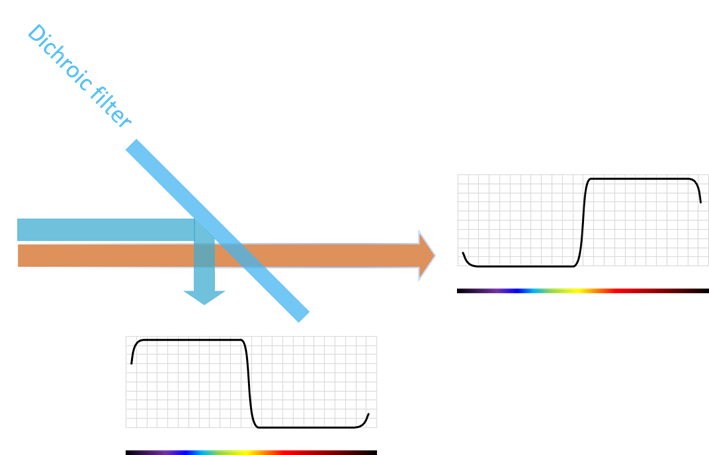
A dichroic beamsplitter is inserted at an angle of 45 degrees relative to the excitation light. The dichroic beamsplitter reflects light at the excitation wavelength and transmits light at the emission wavelength.
Download this White Paper
Take advantage of this opportunity to expand your knowledge and accelerate your research.
Download this current Fluorescence Spectroscopy white paper
Types of filters
There are in general 3 types of filters used for fluorometers:
In this section we will describe these filters in more detail.
Edge filters
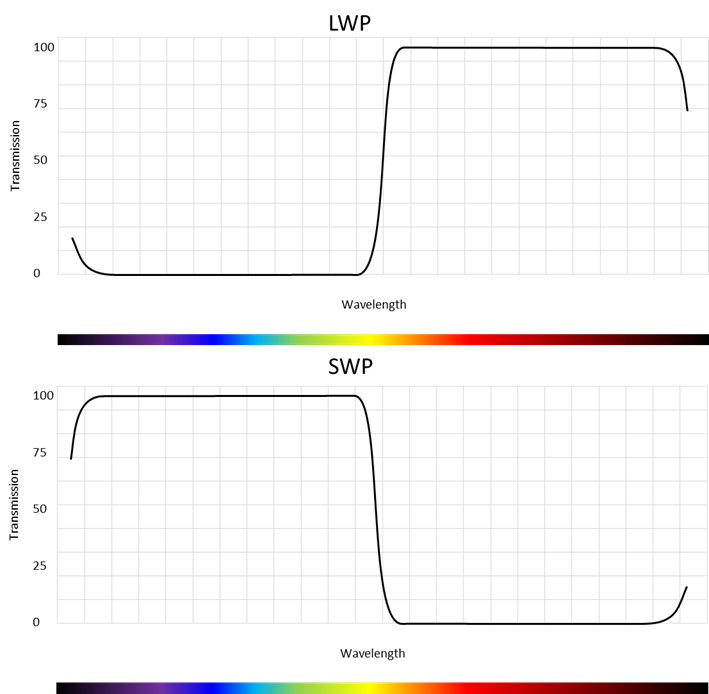
Edge filters come in two versions – Long Wave Pass (LWP) and Short Wave Pass as sketched on Figure 7.
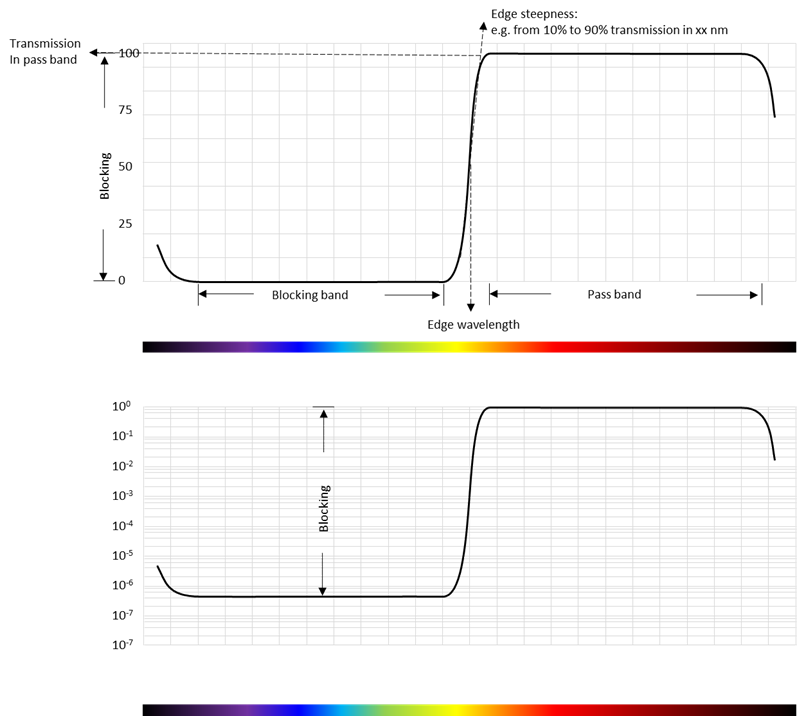
The key parameters for an edge filter are:
- The edge wavelength
- The transmission in the passband
- The attenuation in the blocking band
- The steepness of the edge
- Pass band
- Blocking band
See also Figure 8 for definition of the key parameters. The blocking is best viewed on a logarithmic scale like the bottom graph on Figure 8. The transmission can often be more than 90 % and the out-of-band blocking larger than 6 orders of magnitude (OD6).
SWP edge filters can be used as excitation filters and LWP edge filters as emission filters in fluorometers. Typically, a set of a SWP and LWP with approximately the same edge wavelength will be used for a single fluorophore.
The wide pass band of the edge filters might pick up unwanted ambient light outside the absorption and emission bands of the fluorophore in which case a bandpass filter might be a better solution.
Also, if multiple emission bands are to be measured (i.e. if multiple fluorophores are used) it may be more beneficial to use bandpass filters rather than edge filters as explained in the next section.
Bandpass filters
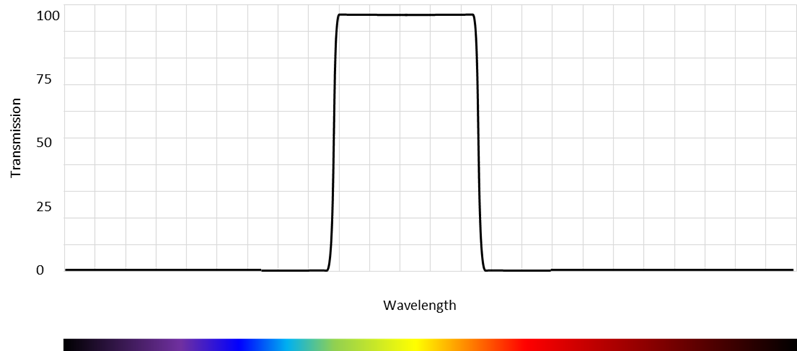
As the name indicates, a bandpass filter allows light to pass in a band of wavelengths and rejects light outside this pass band as shown on Figure 9.
The key parameters for a band pass filter are:
- The center wavelength
- The pass band
- The transmission in the passband
- The attenuation in the blocking bands
- The steepness of the edges
Modern dielectric bandpass filter can obtain more than 90 % transmission in the pass band and more than OD6 rejection in the blocking regions.
A set of bandpass filters can be used in a fluorometer instead of edge filters. In this case, one bandpass filter will have the center wavelength at the absorption peak of the fluorophore and the other band pass filter centered at the emission peak of the fluorophore.
In some applications (like Förster Resonant Energy Transfer – FRET) two emission peaks have to be measured. Therefore, it is beneficial two use two bandpass emission filters centered at each of the two emission peaks.
Dichroics
As mentioned earlier, some fluorometer set-ups use a dichroic beamsplitter to separate the excitation from the emission light. A dichroic filter is a special kind of LWP edge filter that is optimized for 45 degrees Angle of Incidence (AOI).
The dichroic filter is using the fundamental property of a dielectric filter that wavelengths that are not transmitted are reflected. Se Figure 10 for an illustration of how this works.
Since the fluorescent emission is much weaker in intensity than the excitation light it is important that the transmission of the LWP filter is as high as possible. Dichroic filters can typically offer more than 90% transmission. The blocking of the transmitted excitation light is typically 2 – 3 orders of magnitude (OD2-OD3).
Filter cubes
Dichroic filters are typically used together with a pair of excitation and emission filters as sketched on Figure 6. To ease assembly and alignment for the user, these three filters are commonly combined into one filter cube as shown on Figure 11.
Evolution of fluorescence filters
Optical filters for fluorescence spectroscopy were originally made by colored glass or polymers. However, today more advanced interference filters are commonly used because they can be optimized to the exact needs of a specific fluorophore’s absorption and emission spectra.
Color filters
Color filters typically consist of a dye incorporated in a substrate material. These filters function by absorbing parts of the spectrum and transmitting others. For instance, a green glass will allow wavelengths around 550 nm to pass while absorbing wavelengths in the blue and red. The absorption and transmission is dependent on the thickness of the filter.
The key benefit of a color filter is that it absorbs the unwanted light which means that there is no stray light to consider in the fluorometer design. However, color filters have several drawbacks. First of all, the usable center wavelengths and bandwidths are limited by the dyes available. Furthermore, the edge steepness is often quite low. Certain color filters are also sensitive to humidity and temperature and most therefore be protectively coated.
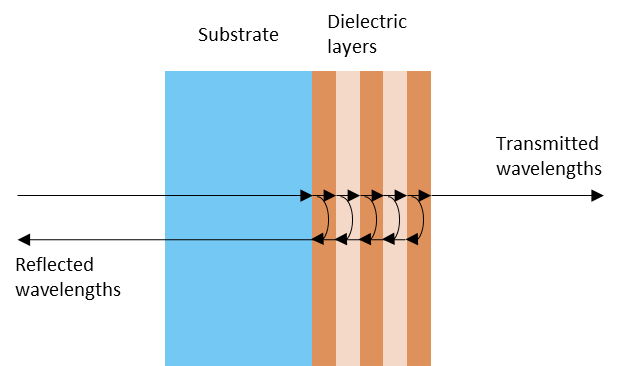
Interference filters
In the 1960’es interreference filters became available as an alternative to color filters. Interference filters are manufactured by depositing thin layers of dielectric materials of different refractive index and thickness on a glass substrate. As the name implies, an interference filter functions by transmitting wavelengths with constructive interference in the dielectric stack while reflecting the remaining wavelengths. See Figure 12 for a sketch of how an interference filter functions.
The key benefit of interference filters over color filters is that the interference filters can be designed and manufactured exactly as required by a given application. Also, the performance of interference filters in terms of for instance edge steepness normally outperforms color filters. As an example, the Schott OG515 LWP filter is a color filter with an edge of 515 nm and a transition from 10% to 90% transmission over 31 nm (from 503 – 534 nm) whereas the Delta Optical Thin Film interference filter LF101594 also has an edge at 515 nm but a transition from 10% to 90% over only 5 nm (from 512 – 517 nm).
The first interference filters were manufactured by Ion Assisted Deposition which were a slow process and also resulted in so-called “soft coatings” that were not very durable and had to be sealed.
Later, Ion Beam Sputtering were introduced which produced “hard coatings” that were durable. Unfortunately, this process is very slow leading to higher cost and limitations on how many layers can be practically deposited.
Magnetron sputtering is a new technique, employed by Delta Optical Thin Film, that provides both fast deposition rates as well as hard durable coatings. This process is very well suited for cost-effective manufacturing of high-performance filters for fluorometers for POC in high volume.
Fluorometers for Point-of-Care
Point of care (POC) instruments are a special kind of medical devices intended for bed-side, at the clinic or even at home diagnostics. Such instruments are generally characterized by being compact, cost efficient and easy to operate.
Many POC instruments typically measure chemical reactions of biological samples and fluorescence is one of the methods used for this.
As an example, we will describe how a POC fluorometer for rapid detection of Covid-19 can be constructed.
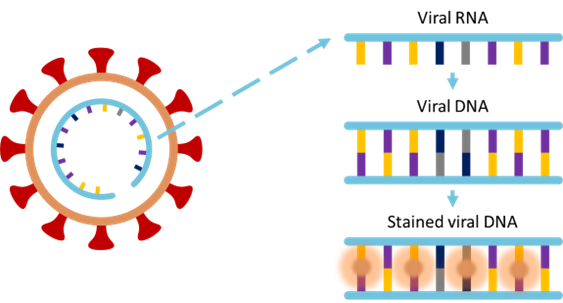
The most common detection method of COVID-19 uses nucleic acid amplification whereby the viral RNA strands are extracted from saliva for instance and amplified to form viral DNA strands. These strands are then stained with a fluorophore that only binds to the viral RNA. In this way the presence of fluorescence emission becomes a direct indicator of the virus.
An example of a fluorophore suited for COVID-19 detection is SYBR Green sold by ThermoFisher which has peak absorption at 498 nm and peak emission at 522 nm as shown on Figure 14.
As mentioned, a POC instrument has to be compact and cost efficient and therefore it is common to choose the 90 degrees configuration. As shown on Figure 15 it may ultimately be possible to build an instrument using a LED for excitation and one excitation and one emission filter.
LEDs are energy efficient and low cost and furthermore has the advantage that they are limited in excitation bandwidth – typically around 20 – 30 nm FWHM. This means that the LED will emit very limited outside the excitation band of the fluorophore.
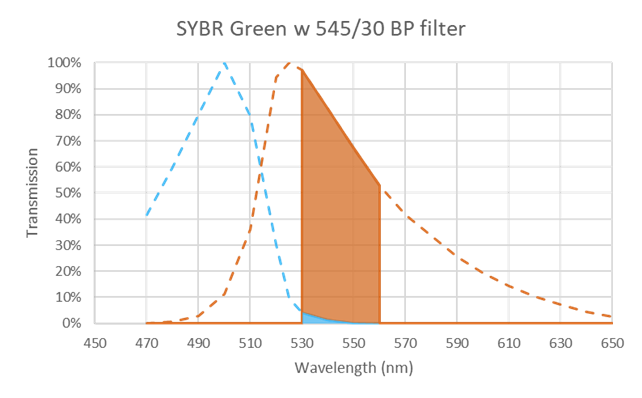
Furthermore, modern bandpass filters, like the ones manufactured by Delta Optical Thin film, can provide very high transmission in the emission band (more than 95%) and very deep blocking (more than OD6) in the excitation band. With SYBR Green as an example Figure 16 shows how a bandpass filter centered at 545 nm with 30 nm bandwidth would pass a large part of the emission and effectively block the excitation.
Finally, the cost and size of the instrument can be reduced by using as small optical filters as possible. Delta Optical Thin Film routinely manufactures fluorescence filters down to a few mm by mm in high volume for POC devices.
Meet the author
Stay updated on our expert insights
Get the latest news and insights about optical filters – subscribe to our newsletter.